

Key Takeaways
Pediatric Growth Chart Percentile
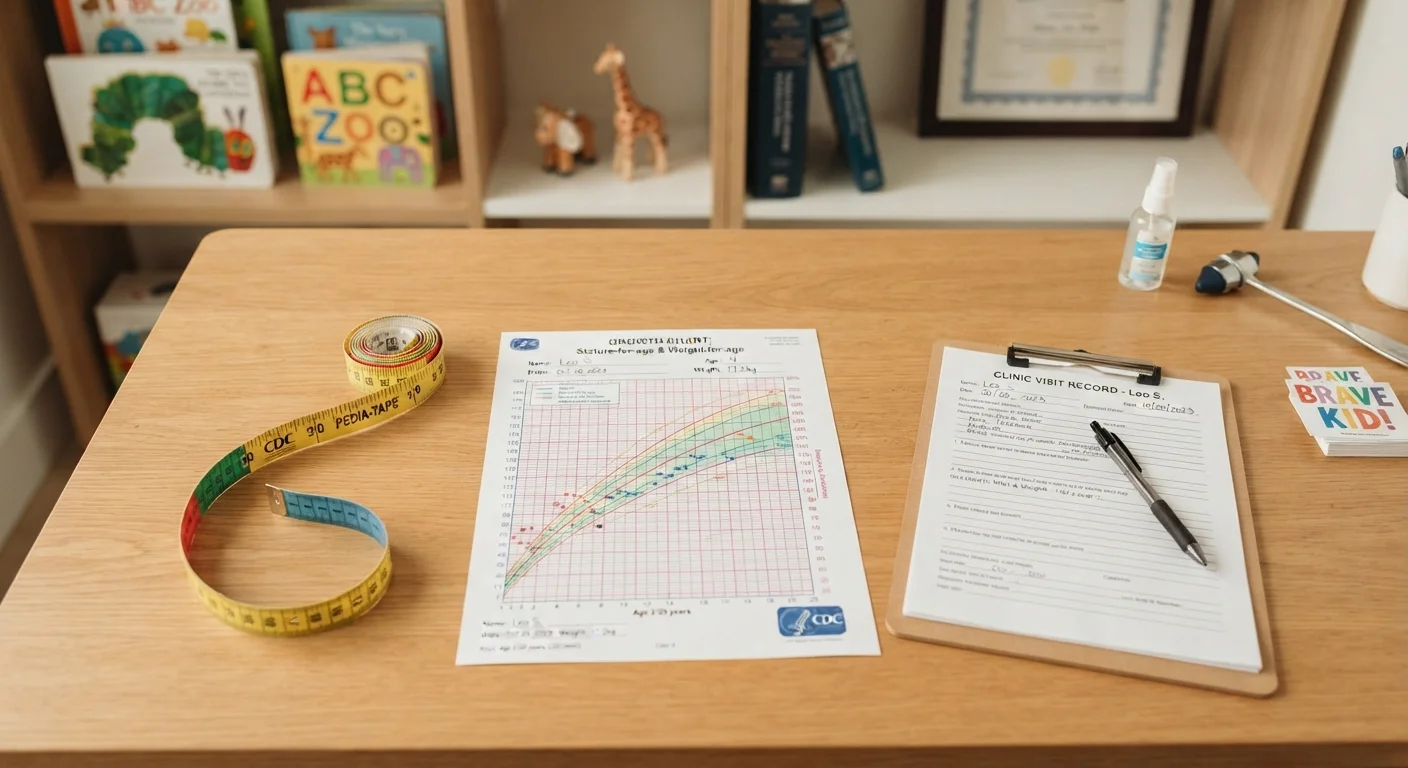
A growth chart percentile tells you how a child's height, weight, or head circumference compares to other children of the same age and sex. If a child is at the 60th percentile for height, it means they are taller than 60 out of every 100 children in the reference group. Percentiles are a range tool, not a ranking of good or bad.
The CDC and the World Health Organization (WHO) each publish separate growth charts; pediatricians in the US typically use WHO charts for children under age 2 and CDC charts for children ages 2 and older.
What the Numbers on a Growth Chart Actually Represent
When a nurse measures your child and announces they are at the "40th percentile," it is easy to assume that means something close to a grade-and that higher must be better. In reality, a percentile is simply a comparison tool. It places your child within a statistical distribution of children the same age and sex, drawn from a large reference population.
The reference data used by most US pediatricians comes from nationally representative samples compiled by the CDC. A child at the 40th percentile for weight is heavier than 40% of children in that reference group and lighter than the remaining 60%. Neither end of that statement is a problem on its own. The chart's job is to show where a child sits, not to judge how they are doing.
3rd-97th
Typical percentile range for healthy children
According to CDC growth chart guidelines, the range from the 3rd to 97th percentile encompasses the vast majority of typically developing children.
2
Chart sets used by US pediatricians
US pediatricians typically use WHO growth charts for children under 2 and CDC charts for children ages 2 and older, reflecting different reference populations.
It helps to think of the chart as a growth map. Just as a road map shows your location without telling you whether that location is desirable, a percentile shows position without declaring it good or bad.
Why Trends Matter More Than Any Single Number
Pediatricians rarely react to a single percentile reading. What they look for is the pattern over time. A child who has consistently measured near the 25th percentile for height across multiple visits is following their own growth curve reliably-and that consistency is reassuring.
The concern arises when a child's measurements shift significantly across major percentile lines in either direction over a short time. A previously 70th-percentile toddler dropping to the 30th within a few months, for example, may prompt questions about nutrition, illness, or other factors. Rapid upward shifts can also merit conversation. These are the signals a growth chart is designed to surface.
Keep a Simple Record at Home
Ask your pediatrician for a copy of your child's growth chart at each visit, or note the measurements in a health journal. Seeing the trend yourself can replace anxiety about individual numbers with a more grounded understanding of your child's growth pattern over time.
This is why well-child visits are so important-each visit adds another data point to the trend line, making the picture clearer over time. A single measurement in isolation tells only a fraction of the story.
Factors That Influence Where a Child Falls
Growth percentiles reflect a mix of genetics, nutrition, sleep, overall health, and environment. Tall parents often have taller children; shorter parents tend to have shorter children. This is sometimes called mid-parental height, and pediatricians may factor it in when interpreting a child's growth trajectory.
Nutrition plays a meaningful role, particularly in the first two years of life when growth is fastest. Nutritional balance across every age shifts considerably from infancy through adolescence, and so does the way those needs show up on a growth chart.
Illness, stress, and chronic conditions can also affect growth patterns. This is why a pediatrician interprets growth data alongside a child's full health history rather than in isolation. Percentile alone does not-and cannot-tell the whole story.
Growth Charts Are Population References, Not Norms
The reference populations used to build growth charts may not perfectly reflect every ethnic, geographic, or socioeconomic group. Pediatricians are trained to interpret charts with this in mind and to weigh cultural and familial context alongside the data. If you ever feel a measurement is being interpreted without that fuller context, it is entirely appropriate to ask questions.
When to Bring Questions to Your Pediatrician
Most percentile readings simply confirm that a child is growing along their established curve. But there are moments when it makes sense to ask more questions. If you notice your child's clothing sizes seem to stall, they seem unusually fatigued, or their appetite has changed significantly, these are worth mentioning at the next visit-not as emergencies, but as part of the conversation.
Parents sometimes worry about weight-related percentiles in ways that can feel loaded. It is worth knowing that childhood weight is often misunderstood, and that pediatricians use multiple data points-not just a weight percentile-before drawing any conclusions. If you have concerns between scheduled visits, do not hesitate to reach out to your child's care team.
“Growth charts are tools to help identify children who may need further evaluation-they are not meant to label children as too big or too small, but to track how each child is growing over time.”
— American Academy of Pediatrics, Professional organization representing US pediatricians and pediatric subspecialists
This article is for general informational and educational purposes only and is not a substitute for professional medical advice. Always consult your child's pediatrician or a qualified healthcare provider with questions about your child's growth, development, or health.